If software ate the world, models will run it. But are we ready to be controlled by blackbox intelligent softwares?
Probably not. And this is fair. We, as human, need to understand how AI works — especially when it drives our behaviours or businesses. That’s why in a previous post, we spotted machine learning transparency as one of the hottest AI trends.
Let us walk through a brief history of machine learning models explainability — illustrated by real examples from our AI Claim Management solution for insurers.
Starting simple — Linear models coefficients
Linear models explainability is straightforward. The prediction is the linear combination of the features values, weighted by the model coefficients.

However, the highest accuracy for large modern datasets is often achieved by complex models, that even experts struggle to interpret (see picture below).

If linear models explainability is easy, how to achieve it on more powerful non-linear machine learning models, like random forests?
July 2014 — Random Forests features importance
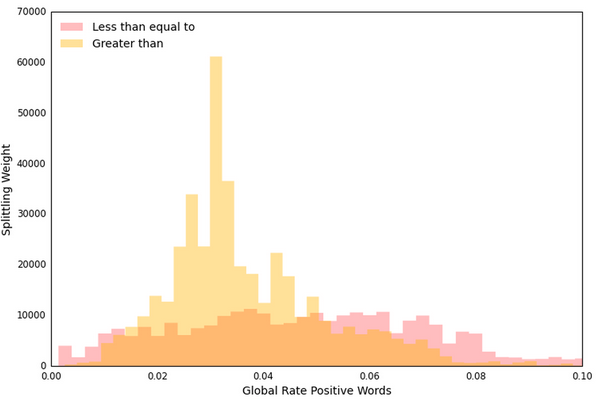
In its PhD thesis, Gilles Louppe analyzes and discusses the interpretability of a fitted random forest model in the eyes of variable importance measures. This is what is behind the famous .feature_importances_ attribute of scikit-learn RandomForest() estimator.
Here is the output of “feature importances” in the context of a predictive insurance claim management solution.

August 2015 — Random Forests features contribution for a given prediction
The previous approach intended to explain features importance of a fitted model at a global population level. This new approach tries to explain features contributions for each prediction individually.
What makes that my machine learning model predicts that M. xxx loan insurance claim is simple and could be settled automatically? Is it mostly the interest rate? Or the amount of capital? Or the type of loan?
Practically, features contribution computation has been made possible thanks to a new capability of scikit-learn 0.17: allowing to store values for all nodes instead of just leaves for decision trees.
This approach has been described here, and is available in the Treeinterpreter package.

October 2015 — Decision threshold distribution
There is not a unique way to inspect and understand fitted Random Forest models. Airbnb research team published its own approach, focusing on decision threshold distribution.

February 2016 — LIME
As you noticed, previous approaches were focused on what was at that time the most efficient algorithms: Random Forests.
But as more powerful algorithms have emerged (neural networks, gradient boosting trees, ensembling, …), a new generation of explainability technics appeared, suitable to any machine learning model — not only tree-based.
The first explainability method of this type was published in the paper: “Why Should I Trust You?”: Explaining the Predictions of Any Classifier. It explains the predictions of any classifier in an interpretable and faithful manner, by learning an interpretable model locally around the prediction.
This method is available out of the box in the LIME package (Local Interpretable Model-Agnostic Explanations).
June 2016 — The Myth(o)s of Model Interpretability
Whereas explainability technics have multiplied, the necessity to better define this concept begun to arise.
What do we mean by interpreting a machine learning model, and why do we need it? Is it to trust the model? Or try to find causal relationships in the analyzed phenomenon? Or to visualize it?
These aspects are covered in depth in the paper “The Mythos of Model Interpretability”.
May 2017 — SHAP
As we see above, several methods have been proposed over time, to help users interpret the predictions of complex models. But it is often unclear how these methods are related and when one method is better suited than another.
SHAP is an attempt to unify six previous explainability methods (like Treeinterpreter, LIME, …), and make their results more robust, consistent, and aligned with human intuition.
This is probably the current state-of-the-art explainability method. And there is a Python library available!

2018: What’s next?
Explaining complex machine learning models is a hot research topic. Progress will be made for sure in the coming years.
New papers are published every week, in conferences like KDD, or directly on arXiv.
Tensorflow released this month a “what-if” tool to visually inspect machine learning models, and Kaggle released last week a series of tutorials on ML transparency.
An entire e-book is even available online, with several references.
In a word, what an exciting moment for Machine Learning Explainability!
Like what you read? Want to join Zelros tech team as a data scientist, software engineer, or solution engineer? We’re hiring!
